How State Agencies Estimate Deer Populations
Bernie Barringer 07.05.16
Like me, no doubt you have marveled at the numbers being thrown about by state game agencies when it comes to their deer populations and harvest management objectives. One state agency might say they have 1 million deer and 3 years later they say they have 875,000. Another state might say they have 480,000, which is up from 425,000 just 3 years previous.
Where do they get these numbers? Sometimes it seems as if they just grab them out of the air or take them from some computer model. Often, our personal observations don’t seem to match the numbers being put forth by the state agency. Let’s take a look at how most state agencies arrive at these numbers and then how they adjust these numbers based on trends.
How Many Deer Are There?
To recognize trends in population dynamics, there must first be a baseline. Researchers need a number to start with. Something called “random sampling” doesn’t really sound like science, but it is. Let’s say a team of surveyors goes out in each county in the state and spotlights likely looking deer habitat for 4 hours. There is one team per county, and each team spotlights fields in about 10 percent of the county. They count every buck and doe they see.
This is a random sample and it can be extrapolated with remarkable accuracy. Because 10 percent of the areas were counted, you can take the count times 10 and you have a reliable estimate of the number of deer in the state. This 10 percent count has less than a 2 percent statistical margin for error.
But they do not end it there. Most states also use random sampling in aerial surveys, where they fly over areas during winter and count deer because they show up well in the snow. If you have never tried this, you’d be shocked at how well you can see them. Some states have also used counts of deer droppings in wintering areas, roadkills and other methods of estimating deer populations. More recently, scouting cameras are being used to tighten up the data.
The more data that is collected, the more reliable the estimates become. Done for just 1 year, these surveys are quite reliable, but combine and average the data for 10 years, or 20, and you have some pretty accurate numbers.
However, many things can change the numbers. Harsh winters, disease, drought, overharvest, predators, etc. can all cause significant upturns or downswings in deer populations. These trends are followed closely by including factors such as fawn recruitment rates, significant changes in survey numbers and harvest reporting.
Fawn Recruitment Rates
Understanding fawn recruitment rates has proven to be one of the best indicators of population trends and their causes. Fawn recruitment – the number of young deer in the population – can be tied to predation and habitat quality. When fawn recruitment rates plummet, it’s usually either a bad year for food availability, or a rise in predator populations. In some areas, predators are taking up to 80 percent of the fawns from the deer population. Poor pelt values for coyotes is one of the reasons, as coyote populations are high in many areas of North America. Bobcats, bears and wolves are taking a big toll in some areas as well.
The surveys described above are indicators of low fawn recruitment, but the best indicator is the number of young-of-the year deer in the harvest. Most adult does will produce two fawns under normal habitat conditions. About 50 percent of the yearling does breed, and they average about one fawn. These numbers can be used to estimate the number of increase in young-of-the-year deer in the harvest. Of course, a relatively small number of fawns actually make it until the fall hunting season. When fawn recruitment rates are near .75-1.00, the herd is healthy and growing. Some states record negative numbers in fawn recruitment, which means the overall population is dropping.
Surveys
Road kills, spotlight surveys, aerial surveys and other methods help determine the overall population, but more importantly, they help identify population trends. When the number of deer is down in a spotlight survey, for example, and the number of roadkills dropped, biologists have an indicator that the population is dropping.
Of course, other factors can influence these numbers. Poor weather or fog during a spotlighting night can skew the numbers. Lack of snow during winter aerial surveys can make for poor deer counting conditions. All these things are taken into consideration when the numbers are tabulated, but as you can imagine, this is an inexact science. Biologists must do the best they can with the data they can gather. The more data sources available, the more accurate the numbers will be.
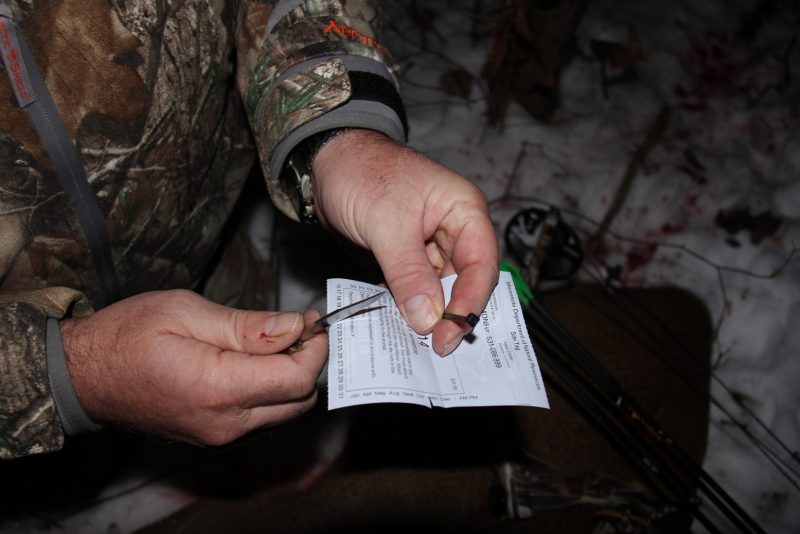
Reporting
Fawn recruitment rates and population trends can be very strongly influenced by harvest statistics. As more states agencies have begun to understand the value of harvest numbers in estimating populations and population trends, they have gone to mandatory reporting. Check stations, online reporting and phone reporting are options in most states. About two-thirds of states now have mandatory reporting for deer harvest. The other one-third use surveys. These surveys are phone calls or mailings that ask the hunters to report their seasonal success.
Mandatory reporting is only as good as the enforcement and many hunters do not report their harvested deer. Agencies use a correction factor to estimate the number of hunters who fail to report, then add that correction into the overall tally. Voluntary sampling is nearly as effective; remember, just a 10 percent response has a statistical error of less than 2 percent.
These voluntary harvest surveys and mandatory reporting have significant value in establishing trends. By learning if a deer killed was a doe or buck fawn, biologists can learn important data in fawn recruitment, for example.
Without question, no one really knows exactly how many deer there are in your state. And sometimes the agencies get it wrong and make decisions based on flawed data. They are not perfect. But the techniques used to estimate populations and trends are remarkably accurate over the long term, and the people in your state game departments are doing the best they can with the data they gather. The vast majority of the time, they are a lot closer to an accurate estimate of these numbers than are their critics.